Topics:
Data Visualization Reporting5 Building Blocks for Successful Data Analysis and Visualization
Written by Jean Lauth

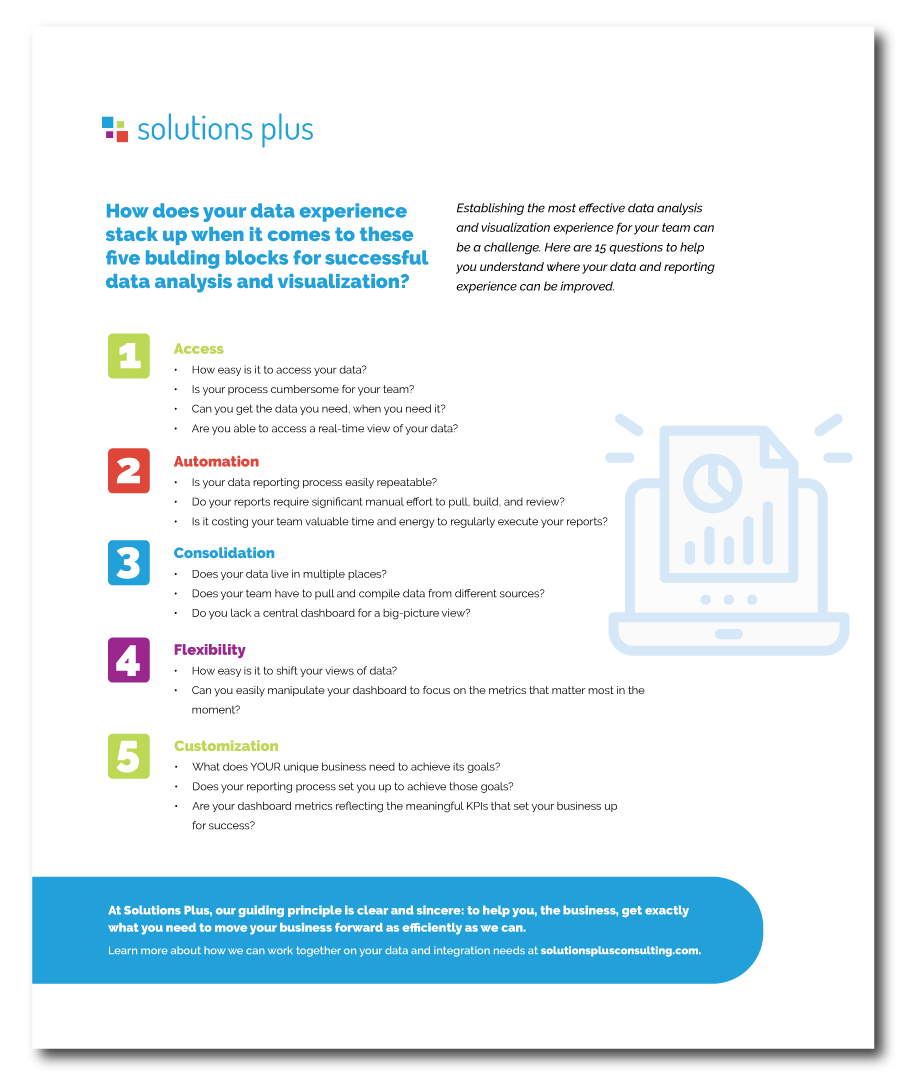
A data-driven approach to business is no longer an option but a necessity. Establishing the most effective data analysis and visualization experience for your team, however, can be a challenge. In order to achieve the most success using data to achieve your business goals, the following five building blocks need to be in place.
Access
How easy is it to access your data? This is often one of the biggest challenges in achieving and maintaining a data-driven approach. Cumbersome processes are a burden to your team and your business goals. You should be able to get the data you need, when you need it, and have a real-time view. Without the ease of access, you risk losing out on making critical decisions faster or missing the boat entirely.
Automation
Is your data reporting process easily repeatable? If your data analysis and visualization experience requires significant manual effort to pull, build, and review, it’s costing you valuable time and energy. You need an automated approach that keeps your data current and is easy for your team to execute regularly.
Consolidation
Does your data live in multiple places? Pulling and compiling data from multiple sources–even if they have easy access–is holding you back. Streamlining allows you to create one central, consolidated dashboard or system, cuts time, and creates a better, big-picture view.
Flexibility
How easy is it to shift your views of data? While repeatable processes are ideal, sometimes you need a different view to solve the problem at hand. You should be able to easily manipulate your dashboard to focus on the metrics that matter most in the moment.
Customization
What does YOUR unique business need to achieve its goals? No two businesses or organizations are alike, which means you need a customized solution to execute your data-driven approach.
At Solutions Plus, our guiding principle is clear and sincere: to help you, the business, get exactly what you need to move your business forward as efficiently as we can.
We’ll leave the technical jargon behind and speak your language to help you cut through to the best possible solution.
Learn more about how we can work together on your data and integration needs.

Free Guide
Want to make sure your building blocks are in place? Download the free one-page guide with 15 questions to help you assess your data and reporting set-up.


